Survey analysis — what the pulse survey shows
Simulated data constructed for portfolio purposes. Brightline Health Services is fictional. The survey file (
survey-data-simulated.csv, n = 200) was generated by a seeded script with designed patterns — see the survey data README for the full generation method and column dictionary. The analysis below demonstrates how the discovery evidence was read; the correlations are designed, not discovered, and are disclosed as such.
Instrument reminder. Staff answered four Likert items (1–5). The key item — “I received useful feedback in the last two weeks” — is the pulse baseline (2.4/5) that the measurement plan tracks quarterly. Managers self-reported their one-on-one cadence and the share of those meetings containing structured feedback.
Finding 1: Feedback usefulness tracks meeting structure, not manager experience
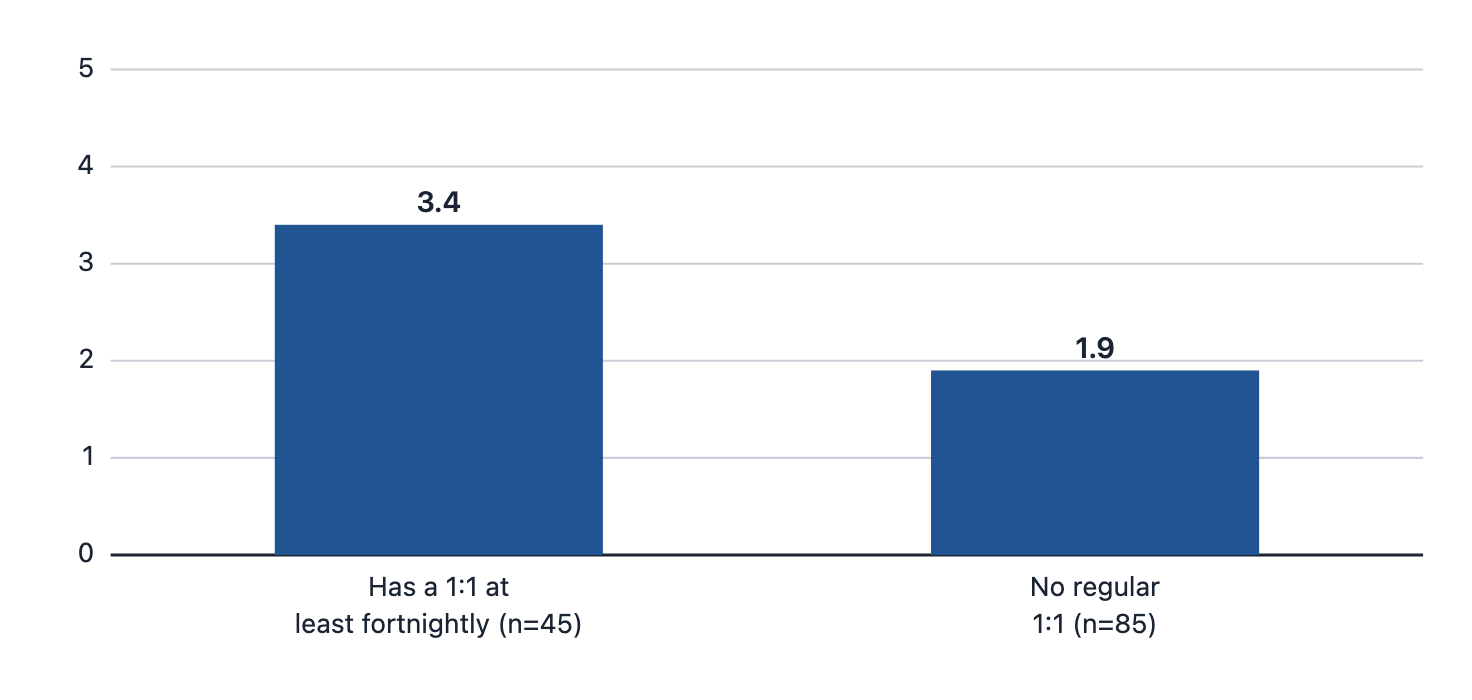
Staff with a one-on-one at least every two weeks rate feedback usefulness 3.4/5; staff without one rate it 1.9/5 — a gap of 1.5 points.
| Group | n | Mean usefulness (/5) |
|---|---|---|
| Has a 1:1 at least fortnightly | 45 | 3.4 |
| No regular 1:1 | 85 | 1.9 |
| All staff | 130 | 2.4 |
Finding 2: The larger the span, the lower the usefulness
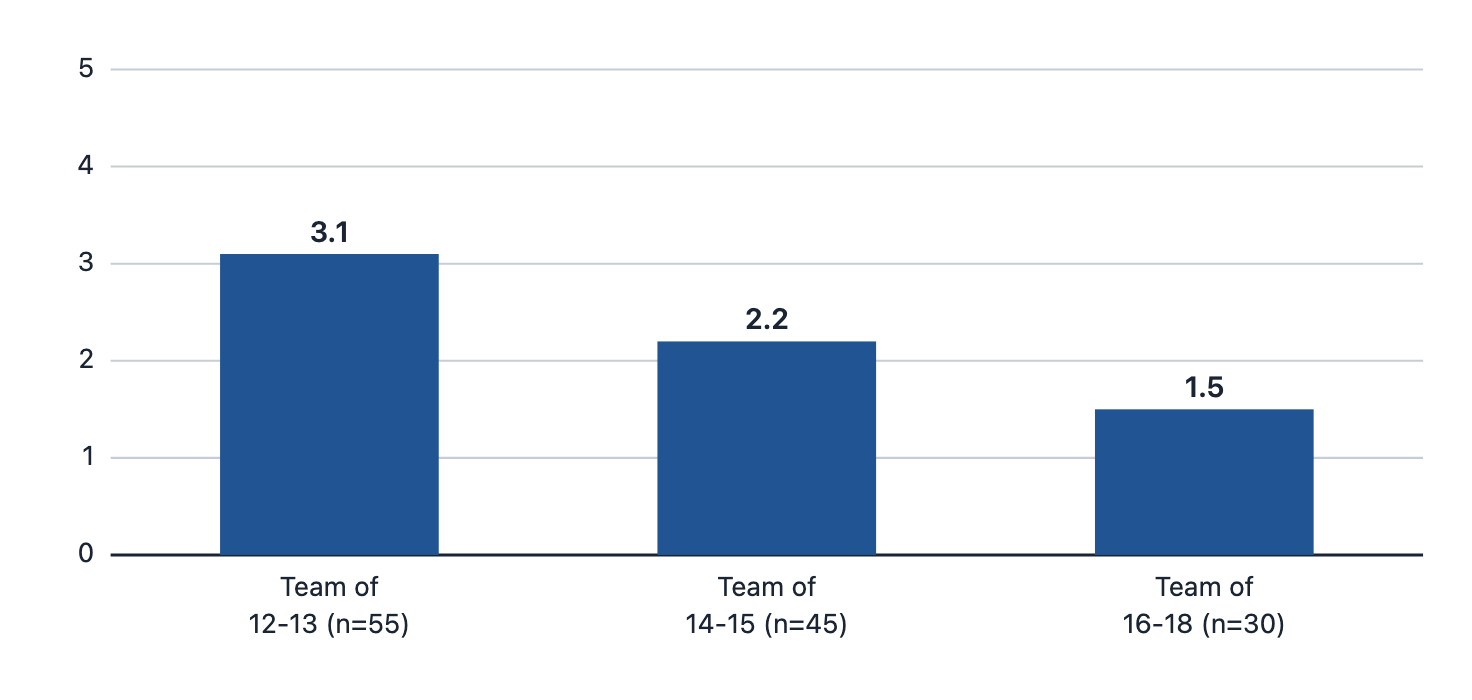
Usefulness falls monotonically with team size — from 3.1/5 on teams of 12–13 to 1.5/5 on teams of 16–18.
| Team size band | n | Mean usefulness (/5) |
|---|---|---|
| 12–13 reports | 55 | 3.1 |
| 14–15 reports | 45 | 2.2 |
| 16–18 reports | 30 | 1.5 |
Finding 3: Manager tenure barely matters
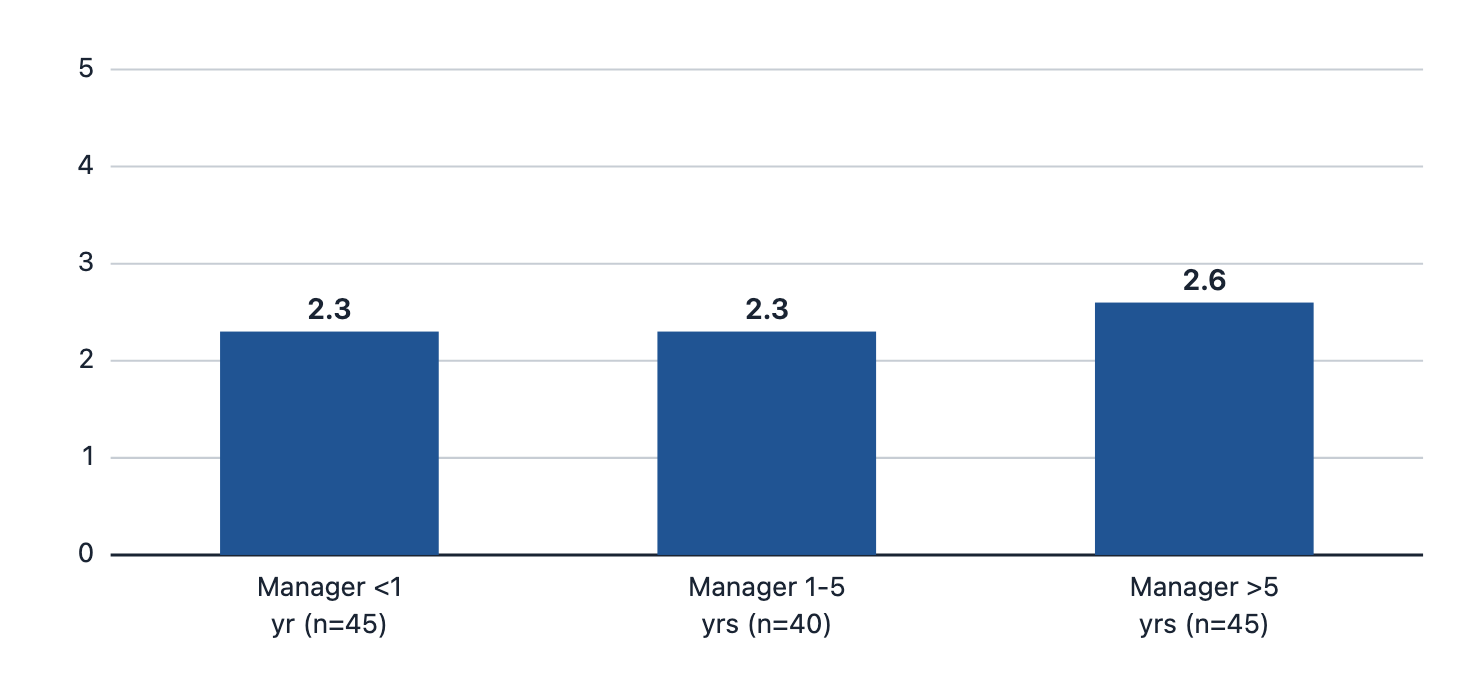
If the problem were “inexperienced managers”, usefulness would rise sharply with manager tenure. It does not — the spread across tenure bands is 0.3 points, against 1.5 points for meeting structure.
| Manager tenure band | n | Mean usefulness (/5) |
|---|---|---|
| < 1 yr (expansion cohort) | 45 | 2.3 |
| 1–5 yrs | 40 | 2.3 |
| > 5 yrs | 45 | 2.6 |
This is the finding that redirects the whole engagement: “train the new managers” would miss most of the problem. The manager-side data agrees — new managers are slightly more likely than veterans to report a fortnightly-or-better cadence (8 of 25, 32%) than managers over 5 years (7 of 25, 28%).
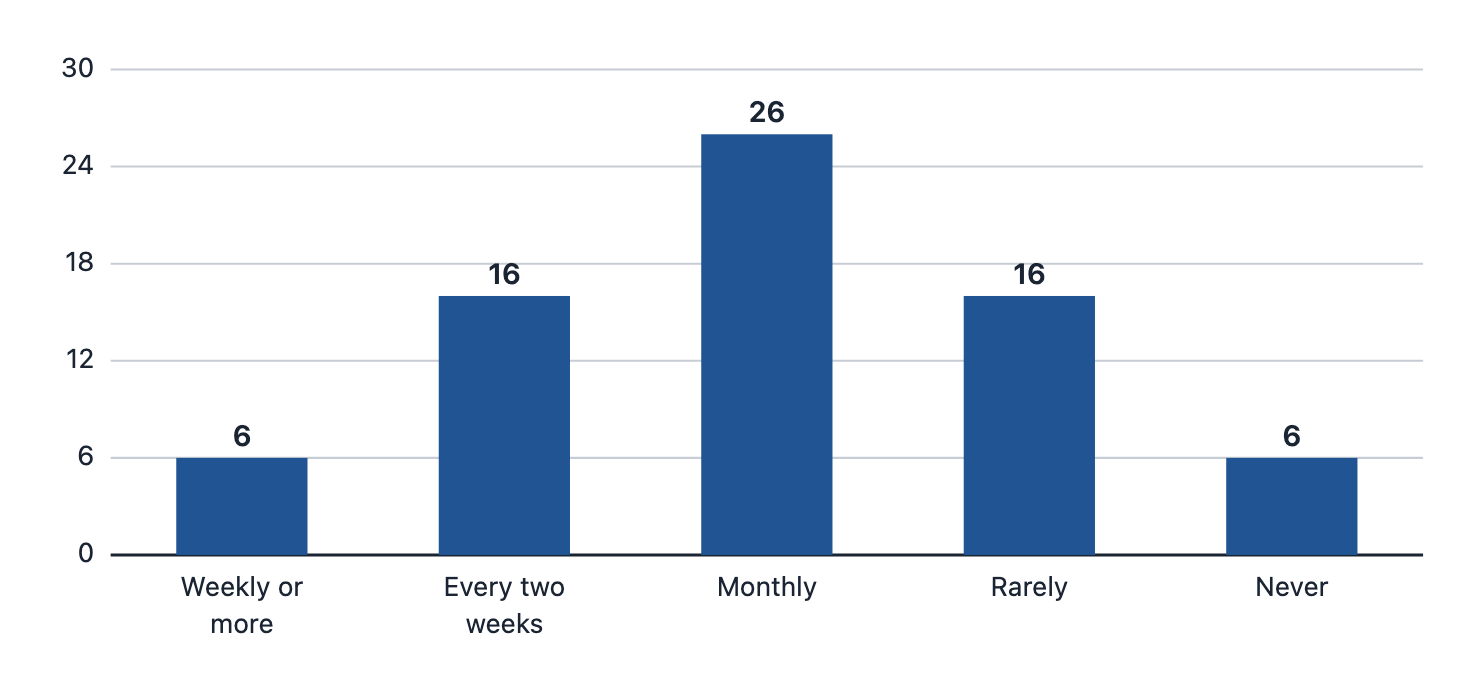
Finding 4: Only 31% of managers hold one-on-ones at least fortnightly
| Self-reported cadence | Managers | % of 70 |
|---|---|---|
| Weekly or more | 6 | 9% |
| Every two weeks | 16 | 23% |
| Monthly | 26 | 37% |
| Rarely | 16 | 23% |
| Never | 6 | 9% |
| Fortnightly or better | 22 | 31% |
And the meetings that do happen are thin: managers report that only about 1 in 5 one-on-ones (mean 20%) include structured feedback — a specific behavior, its impact, and an agreed next step. Meeting more without changing the content is not the fix.
Finding 5 (the one that doesn’t fit): Cedar Point meets constantly and still scores worst
Cedar Point’s staff report the most frequent one-on-ones in the company (mean 4.3/5) and the lowest feedback usefulness (1.5/5 vs 2.5/5 elsewhere). Its managers meet weekly — and report almost no structured-feedback content in those meetings. HR’s business partner flagged the same anomaly in interviews.
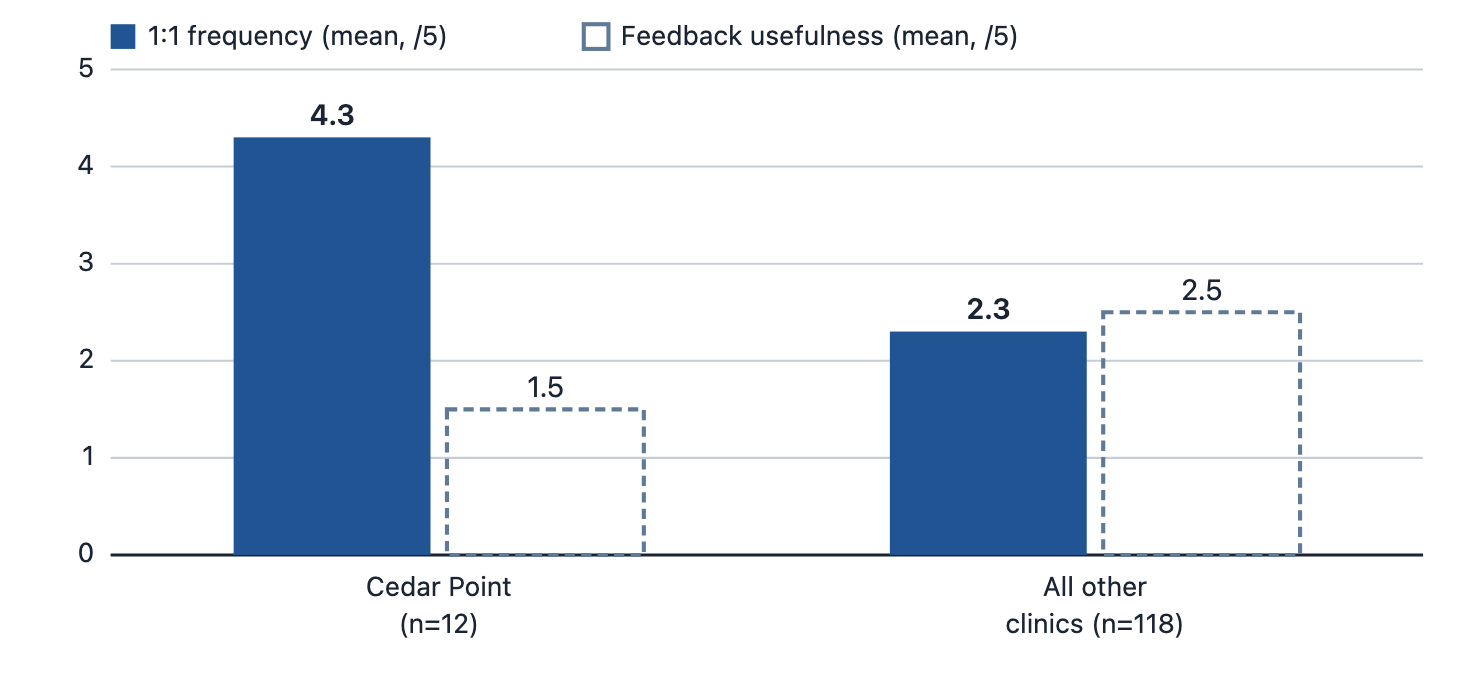
| Clinic | n | Mean 1:1 frequency (/5) | Mean usefulness (/5) |
|---|---|---|---|
| Cedar Point | 12 | 4.3 | 1.5 |
| All other clinics | 118 | 2.3 | 2.5 |
Why it matters: it kills the tempting simplification “just make managers meet more.” The intervention has to shape the content of one-on-ones (template, structured feedback), not only the frequency. This is why the solution pairs the cadence fix with the job aid and the scenario.
Interpretation and limits
Reading: the four findings triangulate with the interviews and document review: feedback at Brightline fails mainly for environmental and process reasons (no scheduled one-on-ones, spans of 12–18, a ratings-only review form), with a narrower skill gap (structuring a feedback conversation) and a consequence gap (scorecards pay for throughput only).
Limits (stated plainly):
- All data is simulated, constructed for portfolio purposes; no real organization is described.
- The survey is a cross-sectional snapshot — the associations above are correlations. In the fiction they would justify a controlled pilot (see the staggered-rollout design in the measurement plan), not conclusions.
- n = 200 with cluster sampling by clinic; clinic-level comparisons (like Cedar Point) rest on small n.
- Self-reported cadence was not audited against calendars for the full sample (the discovery calendar audit sampled one clinic; see the completed intake).
Where this goes next: the performance gap statement and the root-cause analysis.