Baseline dashboard — where Brightline starts
Simulated data constructed for portfolio purposes. Brightline Health Services is fictional. These are the baseline values the measurement plan tracks against; the survey-derived figures come from the generated CSV documented in the survey data README. Post-launch quarters would appear here — none exist because there was no real deployment.
Baseline vs. targets at a glance
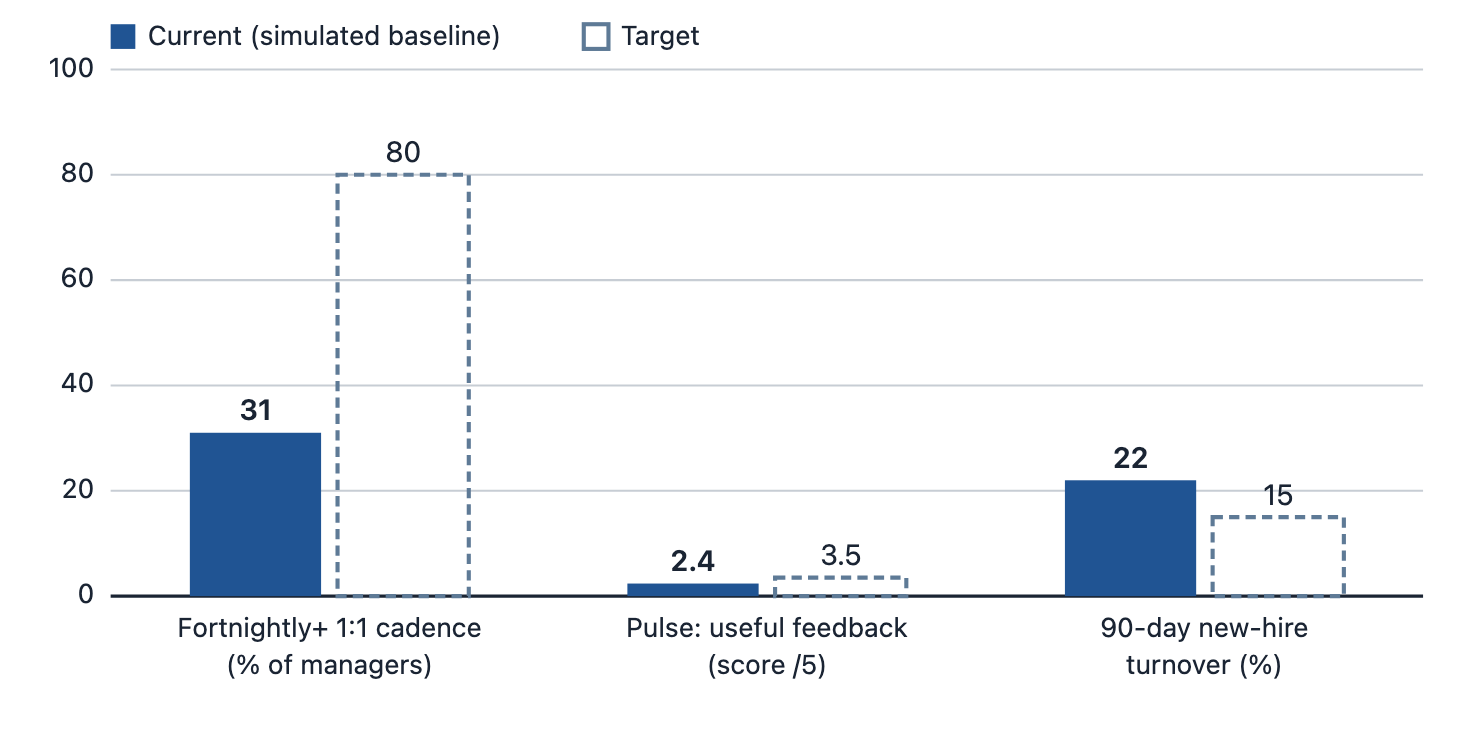
| Indicator | Baseline (simulated) | Target | When |
|---|---|---|---|
| Fortnightly+ 1:1 cadence (% of managers) | 31% (22 of 70) | 80% | 6 months |
| Pulse: useful feedback (/5, staff n=130) | 2.4 | 3.5 | 2 quarters |
| 90-day new-hire turnover | 22% (17 of 78) | 15% | 12 months |
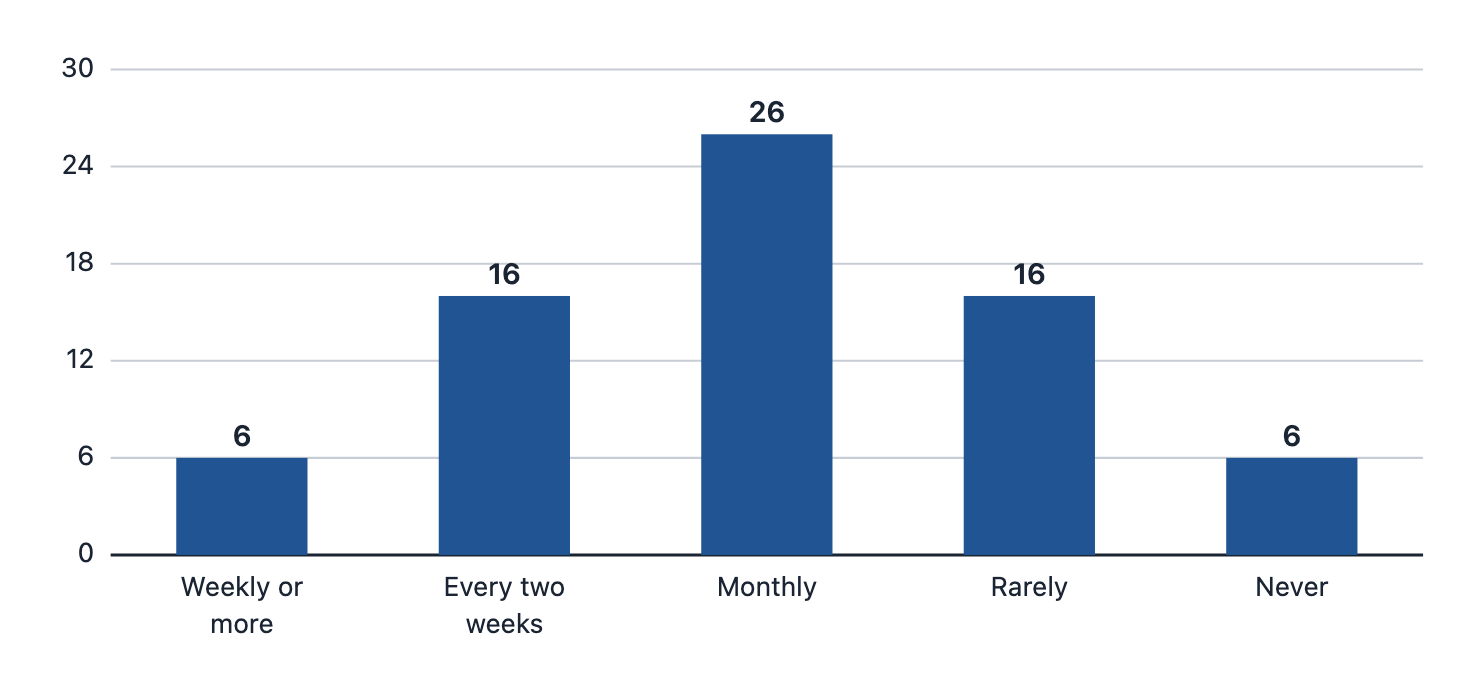
Manager cadence detail
| Cadence | Managers | % |
|---|---|---|
| Weekly or more | 6 | 9% |
| Every two weeks | 16 | 23% |
| Monthly | 26 | 37% |
| Rarely | 16 | 23% |
| Never | 6 | 9% |
| Fortnightly or better | 22 | 31% |
Managers also self-report that only about 1 in 5 of their one-on-ones (~20%) contain structured feedback — so “more meetings” without structure would miss the point (the Cedar Point finding).
90-day turnover — trailing four quarters (HRIS, simulated)
| Quarter | New hires | Left within 90 days | Rate |
|---|---|---|---|
| Q4 2025 | 21 | 4 | 19.0% |
| Q1 2026 | 19 | 4 | 21.1% |
| Q2 2026 | 20 | 5 | 25.0% |
| Q3 2026 | 18 | 4 | 22.2% |
| Trailing 12 months | 78 | 17 | 21.8% → 22% |
Exit-interview coding for the 17 exits: “no feedback / didn’t feel supported” appears as a stated factor in 9 of 17 (HR, simulated coding). At an estimated $9,400 per new-hire exit, the trailing-year cost is ≈ $160k; reaching 15% avoids ≈ $47–56k/year (7 points × 78 new hires ≈ 5–6 exits).
What happens to this page
After each quarterly pulse, the new numbers go on this dashboard next to the baseline, with the comparison-group split (wave 1 vs. wave 2 clinics) from the measurement plan. If the numbers stop matching the targets, the plan’s stop/adjust rule applies — not a quieter chart.